Lesson 1
Overview
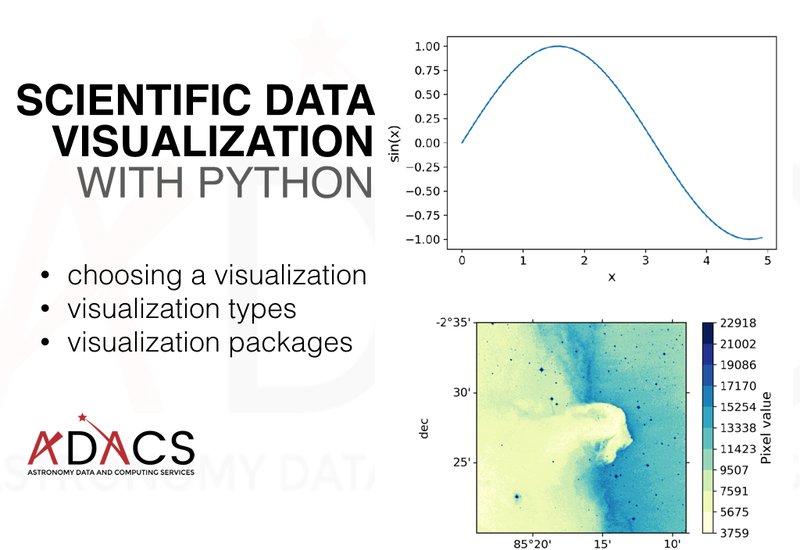
Visualization is a key way we interact with data. Displaying complex relationships in graphs and plots rather than looking at purely numerical output helps us understand our data better. It is important to choose the right type of visualization for the job to convey your science to a third party.
In this course, we will show you how to get started making visualizations using Python.
Course lessons
Introduction
Lesson 2
Choosing a Visualisation
Visualization types with working examples
Lesson 3
Visualization Types - Figures and Images
Lesson 4
Visualization Types - Diagrams
Lesson 5
Visualization Types - Plots
Lesson 6
Data Visualization Jupyter Notebook
To put the concepts we discussed into practice we have prepared several coding excercises for you. Go through them in your own time. The excercises come with solutions !
Follow this link to get started!